
Page 50 - Abbott
P. 50
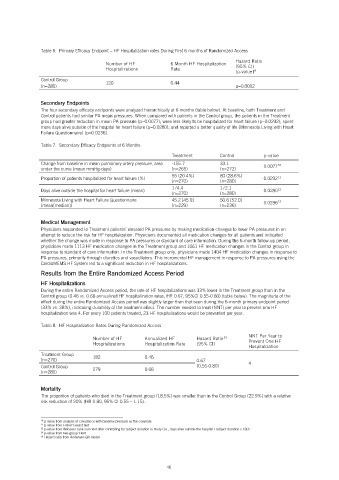
Table 6.  Primary Efficacy Endpoint – HF Hospitalization rates During First 6 months of Randomized Access

                                                                                    Hazard Ratio
                                      Number of HF           6 Month HF Hospitalization
                                      Hospitalizations       Rate                   (95% CI)
                                                                                          9
                                                                                    [p-value]
               Control Group
               (n=280)                120                    0.44                   p=0.0002

               Secondary Endpoints
               The four secondary efficacy endpoints were analyzed hierarchically at 6 months (table below). At baseline, both Treatment and
               Control patients had similar PA mean pressures. When compared with patients in the Control group, the patients in the Treatment
               group had greater reduction in mean PA pressure (p=0.0077); were less likely to be hospitalized for heart failure (p=0.0292); spent
               more days alive outside of the hospital for heart failure (p=0.0280); and reported a better quality of life (Minnesota Living with Heart
               Failure Questionnaire) (p=0.0236).

               Table 7.  Secondary Efficacy Endpoints at 6 Months
                                                             Treatment        Control         p-value
               Change from baseline in mean pulmonary artery pressure, area   -155.7   33.1        10
               under the curve (mean mmHg-days)              (n=265)          (n=272)         0.0077
                                                             55 (20.4%)       80 (28.6%)
               Proportion of patients hospitalized for heart failure (%)                      0.0292
                                                                                                   11
                                                             (n=270)          (n=280)
                                                             174.4            172.1
                                                                                                   12
               Days alive outside the hospital for heart failure (mean)                       0.0280
                                                             (n=270)          (n=280)
               Minnesota Living with Heart Failure Questionnaire   45.2 [45.0]   50.6 [52.0]       13
               (mean[median])                                (n=229)          (n=236)         0.0236

               Medical Management
               Physicians responded to Treatment patients’ elevated PA pressures by making medication changes to lower PA pressures in an
               attempt to reduce the risk for HF hospitalization. Physicians documented all medication changes for all patients and indicated
               whether the change was made in response to PA pressures or standard of care information. During the 6-month follow-up period,
               physicians made 1113 HF medication changes in the Treatment group and 1061 HF medication changes in the Control group in
               response to standard of care information. In the Treatment group only, physicians made 1404 HF medication changes in response to
               PA pressures, primarily through diuretics and vasodilators. This incremental HF management in response to PA pressures using the
               CardioMEMS HF System led to a significant reduction in HF hospitalizations.
               Results from the Entire Randomized Access Period
               HF Hospitalizations
               During the entire Randomized Access period, the rate of HF hospitalizations was 33% lower in the Treatment group than in the
               Control group (0.46 vs. 0.68 annualized HF hospitalization rates, HR 0.67, 95%CI 0.55-0.80) (table below). The magnitude of the
               effect during the entire Randomized Access period was slightly larger than that seen during the 6-month primary endpoint period
               (33% vs. 28%), indicating durability of the treatment effect. The number needed to treat (NNT) per year to prevent one HF
               hospitalization was 4. For every 100 patients treated, 23 HF hospitalizations would be prevented per year.

               Table 8.  HF Hospitalization Rates During Randomized Access
                                                                                        NNT Per Year to
                                                                                14
                                  Number of HF      Annualized HF     Hazard Ratio
                                  Hospitalizations   Hospitalization Rate   (95% CI)    Prevent One HF
                                                                                        Hospitalization
               Treatment Group
               (n=270)            182               0.46              0.67              4
               Control Group      279               0.68              (0.55-0.80)
               (n=280)

               Mortality
               The proportion of patients who died in the Treatment group (18.5%) was smaller than in the Control Group (22.9%) with a relative
               risk reduction of 20% (HR 0.80, 95% CI 0.55 – 1.15).


               10  p-value from analysis of covariance with baseline pressure as the covariate
               11  p-value from Fisher's exact test
               12  p-value from Wilcoxon rank sum test after controlling for subject duration in study (i.e., days alive outside the hospital / subject duration x 180)
               13  p-value from two-group t-test
               14  Hazard ratio from Andersen-Gill model


                                                            46