
Page 53 - Abbott
P. 53
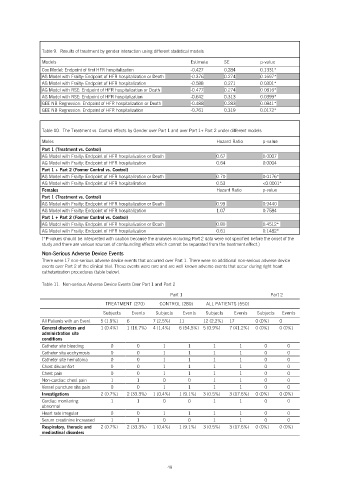
Table 9.  Results of treatment by gender interaction using different statistical models
                Models                                              Estimate    SE          p-value
                Cox Model: Endpoint of first HFR hospitalization    -0.427      0.284       0.1331*
                AG Model with Frailty: Endpoint of HFR hospitalization or Death    -0.376   0.274   0.1697*
                AG Model with Frailty: Endpoint of HFR hospitalization    -0.588   0.271    0.0301*
                AG Model with RSE: Endpoint of HFR hospitalization or Death    -0.477   0.274   0.0816*
                AG Model with RSE: Endpoint of HFR hospitalization    -0.642    0.313       0.0399*
                GEE NB Regression: Endpoint of HFR hospitalization or Death    -0.488   0.283   0.0841*
                GEE NB Regression: Endpoint of HFR hospitalization    -0.761    0.319       0.0172*


                Table 10.  The Treatment vs. Control effects by Gender over Part 1 and over Part 1+ Part 2 under different models
                Males                                                        Hazard Ratio    p-value
                Part 1 (Treatment vs. Control)
                AG Model with Frailty: Endpoint of HFR hospitalization or Death    0.67      0.0007
                AG Model with Frailty: Endpoint of HFR hospitalization       0.64            0.0004
                Part 1 + Part 2 (Former Control vs. Control)
                AG Model with Frailty: Endpoint of HFR hospitalization or Death    0.70      0.0176*
                AG Model with Frailty: Endpoint of HFR hospitalization       0.53            <0.0001*
                Females                                                      Hazard Ratio    p-value
                Part 1 (Treatment vs. Control)
                AG Model with Frailty: Endpoint of HFR hospitalization or Death    0.99      0.9440
                AG Model with Frailty: Endpoint of HFR hospitalization       1.07            0.7584
                Part 1 + Part 2 (Former Control vs. Control)
                AG Model with Frailty: Endpoint of HFR hospitalization or Death    0.80      0.4512*
                AG Model with Frailty: Endpoint of HFR hospitalization       0.61            0.1482*
                (*P-values should be interpreted with caution because the analyses including Part 2 data were not specified before the onset of the
                study and there are various sources of confounding effects which cannot be separated from the treatment effect.)
                Non-Serious Adverse Device Events
                There were 17 non-serious adverse device events that occurred over Part 1. There were no additional non-serious adverse device
                events over Part 2 of the clinical trial. These events were rare and are well known adverse events that occur during right heart
                catheterization procedures (table below).

                Table 11.  Non-serious Adverse Device Events Over Part 1 and Part 2
                                                             Part 1                             Part 2
                                      TREATMENT (270)    CONTROL (280)   ALL PATIENTS (550)
                                     Subjects   Events   Subjects   Events   Subjects   Events   Subjects   Events
                All Patients with an Event   5 (1.9%)   6   7 (2.5%)   11   12 (2.2%)   17   0 (0%)   0
                General disorders and   1 (0.4%)   1 (16.7%)   4 (1.4%)   6 (54.5%)  5 (0.9%)   7 (41.2%)   0 (0%)   0 (0%)
                administration site
                conditions
                Catheter site bleeding   0       0        1        1        1        1        0       0
                Catheter site ecchymosis   0     0        1        1        1        1        0       0
                Catheter site hematoma   0       0        1        1        1        1        0       0
                Chest discomfort        0        0        1        1        1        1        0       0
                Chest pain              0        0        1        1        1        1        0       0
                Non-cardiac chest pain   1       1        0        0        1        1        0       0
                Vessel puncture site pain   0    0        1        1        1        1        0       0
                Investigations      2 (0.7%)   2 (33.3%)   1 (0.4%)   1 (9.1%)   3 (0.5%)   3 (17.6%)   0 (0%)   0 (0%)
                Cardiac monitoring      1        1        0        0        1        1        0       0
                abnormal
                Heart rate irregular    0        0        1        1        1        1        0       0
                Serum creatinine increased   1   1        0        0        1        1        0       0
                Respiratory, thoracic and   2 (0.7%)   2 (33.3%)   1 (0.4%)   1 (9.1%)   3 (0.5%)   3 (17.6%)   0 (0%)   0 (0%)
                mediastinal disorders


                                                            49